
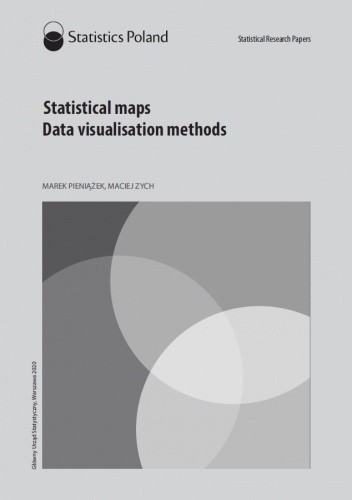
Statistical maps. Data visualisation methods
Marek Pieniążek (statystyk), Maciej Zych
Statistical maps. Data visualisation methods
Marek Pieniążek (statystyk), Maciej Zych
The handbook sets forth standards of cartographic presentation of statistical data, thus responding to the growing demand for information shown in the territorial and spatial contexts. This demand necessitates constant enhancement of the forms of statistical presentation of data – not only as tables and charts, but also on maps. The book also attempts to respond to challenges posed by the recent development of modern tools for data presentation and analysis. It offers a synthesis of cartographic presentation methods, as well as recommendations and good practices in this field. Intended as a set of guidelines on how to make a statistical map adhering to the principles of graphic cartographic presentation, it shows the ways to overcome the limitations of the available IT tools in this respect. A properly constructed map is one of the basic forms of visualisation enabling a fast and effective perception of data indicating spatial relations between phenomena. Bearing this in mind, the authors provide theoretical background and practical guidelines on how to use statistical maps, what kind of content can be presented on them and how to properly make maps intended for statistical publications.
Szczegóły
Rok wydania
2020
Liczba stron
248 str.
Wydawnictwo
Główny Urząd Statystyczny
Język
angielski
Format
papier
Gatunek
popularnonaukowa
ISBN
9788366466098
Inne książki tych autorów
Opinie czytelników
Oceń tę książkę
Oceniona książka trafi na półkę Przeczytane.
Dodaj „Statistical maps. Data visualisation methods" do swojej półki
Załóż darmowe konto i miej swoje lektury, oceny oraz postępy w jednym miejscu. Dołącz do grona zadowolonych czytelników, którzy już wiedzą, co przeczytali i co chcą przeczytać.

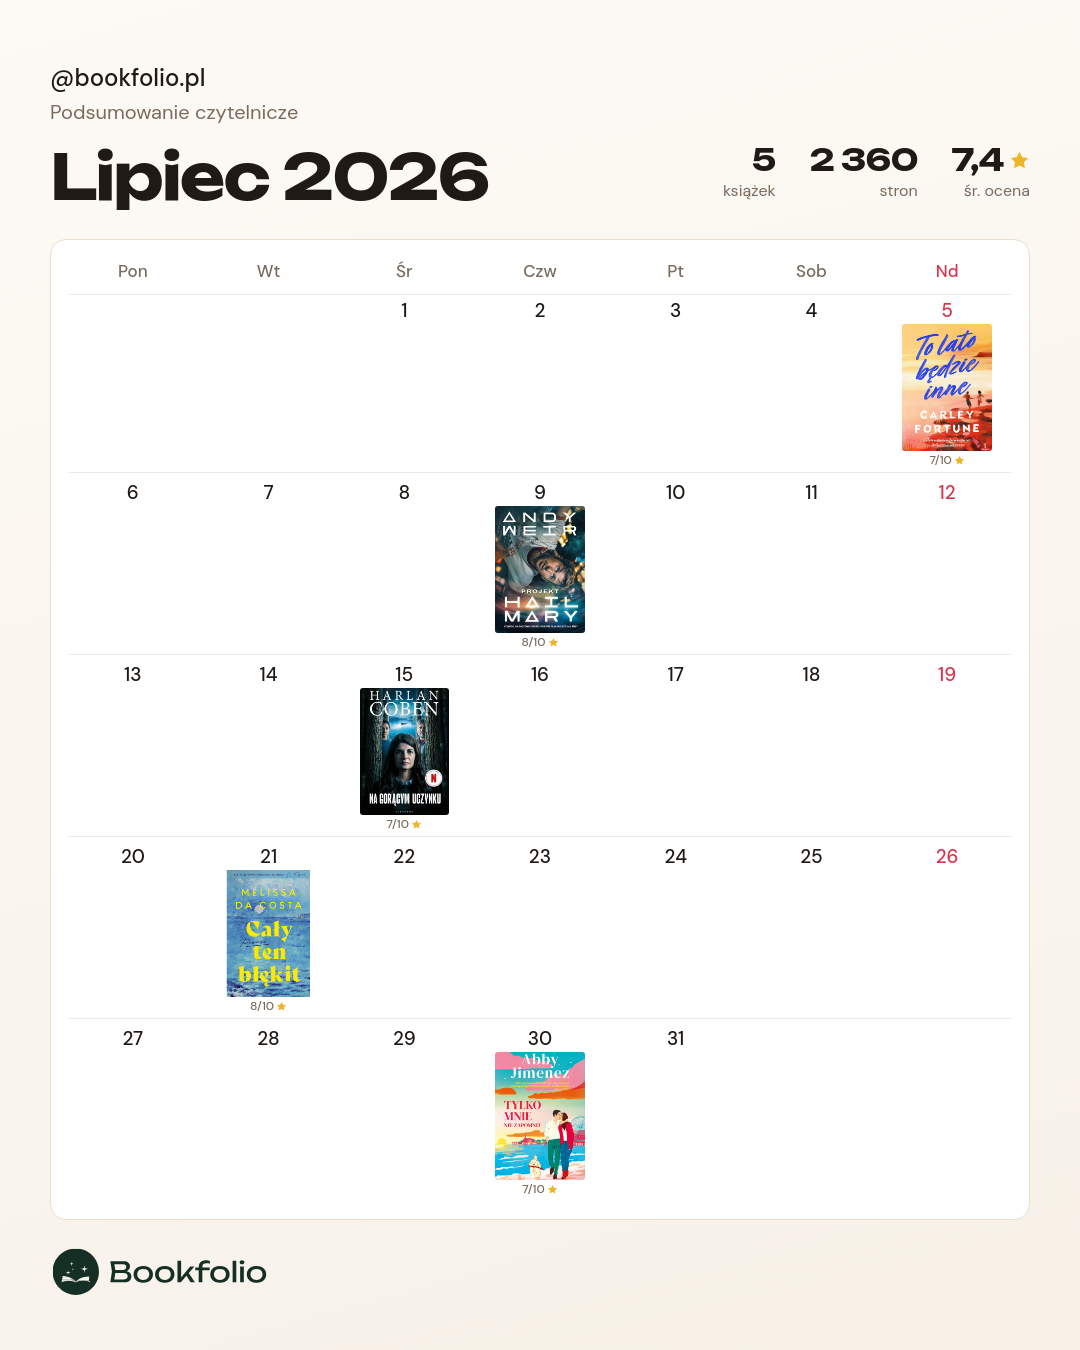

Trzy półki czytelnicze
Przeczytane, Teraz czytam i Chcę przeczytać. Uporządkuj swoje książki w sekundy.
Oceny i recenzje
Skala 1-10, prywatne notatki, ulubione cytaty. Wracaj do swoich opinii kiedy chcesz.
Statystyki i wyzwania
Ustal roczny cel czytelniczy i obserwuj jak rośnie liczba przeczytanych stron.
Rekomendacje i grafiki
Odkrywaj kolejne tytuły i generuj estetyczne podsumowania roku w książkach.